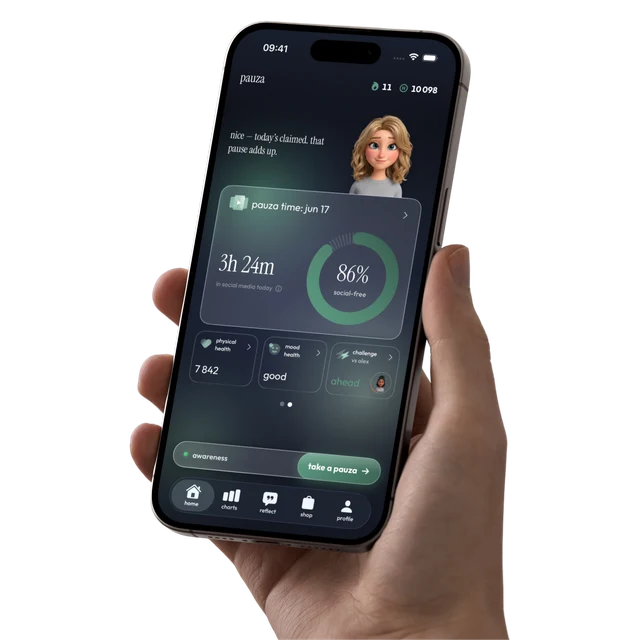
The average internet user now spends 33 hours and 13 minutes per week consuming online media — roughly 4 hours and 45 minutes every day — and well over 2.5 hours of that on social platforms. This page collects the most reliable, current screen time statistics we could verify, each linked to its primary source with the data year labelled. We update it as new reports come out.
how much time do people spend online in 2026?
GWI and DataReportal's Digital 2026 reports switched from daily to weekly figures, so both formats are shown below. The short version: online time eats about 29% of our waking lives, and scrolling social and video feeds alone takes roughly 16%.
- The average global internet user spends 33 hours and 13 minutes each week consuming online media — roughly 4 hours 45 minutes per day.— DataReportal, Digital 2026 Mid-Year Global Update (GWI) · 2026 data
- The typical online adult spends 18 hours and 36 minutes per week — well over 2.5 hours per day — using social media, including social networks and video platforms like YouTube and TikTok.— DataReportal, Digital 2026 Global Overview (GWI) · 2026 data
- Internet users spend roughly 29% of their waking lives consuming online media, and roughly 16% of waking hours scrolling social and video feeds.— DataReportal, Digital 2026 Global Overview (GWI) · 2026 data
- There are 5.79 billion active social media user identities and 6.12 billion internet users worldwide as of April 2026.— DataReportal, Digital 2026 Mid-Year Global Update · 2026 data
- In the last daily-format measurement, adult internet users spent an average of 6 hours 38 minutes per day online across all devices — 3h 46m of it on mobile vs 2h 52m on computers.— DataReportal, Digital 2025 Global Overview (GWI, Q3 2024 data) · 2024 data
is screen time going up or down?
Contrary to the doom headlines, global screen time has plateaued — but it has plateaued at an extremely high level, and app time keeps climbing.
- Global daily time online was 6h 38m in late 2024 — 2 minutes LESS than a year earlier — and daily social media time (2h 21m) was 10 minutes lower than two years before.— DataReportal, Digital 2025 Global Overview · 2024 data
- Consumers spent 5.3 trillion hours in mobile apps in 2025 (+3.8% year over year) — roughly 3.6 hours per day per mobile user.— Sensor Tower, State of Mobile 2026 · 2025 data
social media time by country
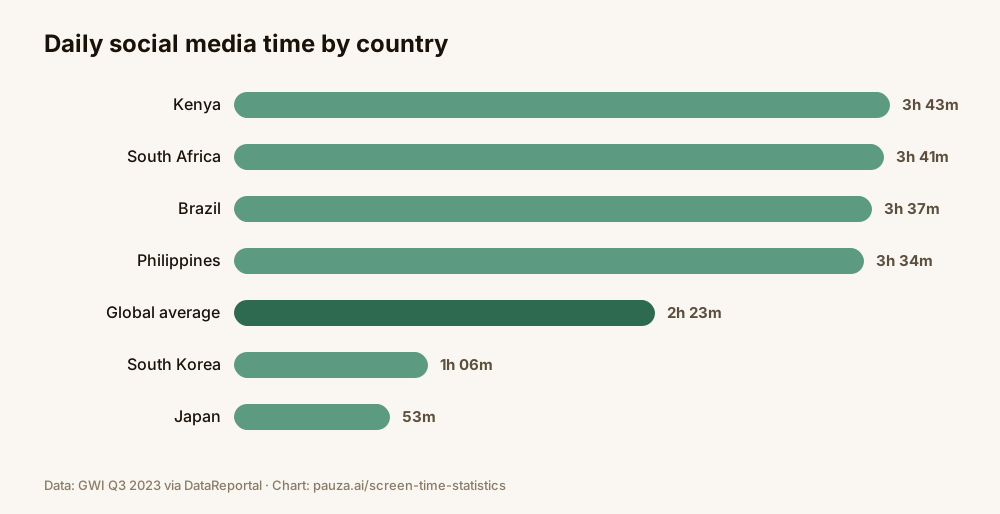
Daily social media time varies more than fourfold between countries. Data below is GWI Q3 2023, published in DataReportal's dedicated deep dive — the most recent country table published in text form.
| Country | Daily social media time |
|---|---|
| Kenya (highest) | 3h 43m |
| South Africa | 3h 41m |
| Brazil | 3h 37m |
| Philippines | 3h 34m |
| Global average | 2h 23m |
| South Korea (2nd lowest) | 1h 06m |
| Japan (lowest) | 53m |
- Nigerians use social media 5.84 days out of every 7 — the world's most frequent users. Japan, South Korea, France, Germany and Czechia are the only large economies where people use social media less than once every two days.— DataReportal, Digital 2026 Global Overview (GWI) · 2026 data
screen time by age group
Age is the single biggest predictor of social media time. Young women are the heaviest users; older men the lightest — but even they average more than an hour a day.
- Women aged 16–24 spend an average of 25 hours 45 minutes per week — more than 3h 40m per day — scrolling social and video feeds, roughly 22% of their waking lives.— DataReportal, Digital 2026 Global Overview (GWI) · 2026 data
- People aged 16–24 use social media on an average of 4.6 days per week, versus just 2.81 days for men aged 65+.— DataReportal, Digital 2026 Global Overview (GWI) · 2026 data
- People aged 16–24 spend more than three times longer on social media each day than people aged 65 and above.— DataReportal, Digital 2025 Global Overview (GWI) · 2024 data
teen screen time statistics
Pew Research surveys U.S. teens every year. The 2025 edition shows the 'almost constantly online' share dipping slightly — but still four in ten.
- 97% of U.S. teens use the internet daily, including four in ten who are online “almost constantly”.— Pew Research Center, Teens, Social Media and AI Chatbots 2025 · 2025 data
- About one in five U.S. teens are on TikTok (21%) and YouTube “almost constantly”; across five major platforms, 36% of teens use at least one almost constantly.— Pew Research Center, Teens, Social Media and AI Chatbots 2025 · 2025 data
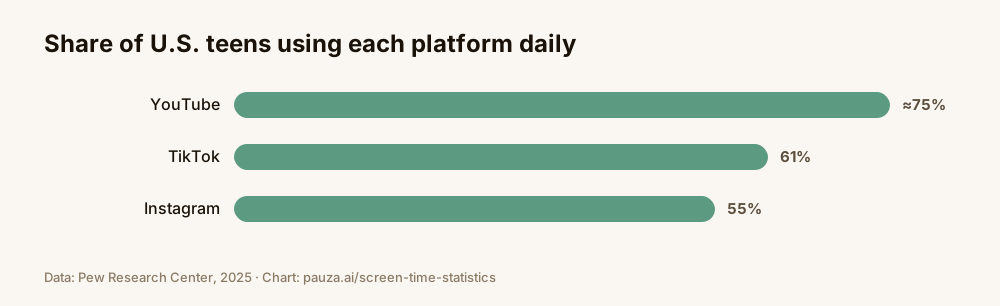
- Roughly 90% of U.S. teens use YouTube and about three-quarters visit it every day; 61% use TikTok daily and 55% use Instagram daily.— Pew Research Center, Teens, Social Media and AI Chatbots 2025 · 2025 data
- 95% of U.S. teens have access to a smartphone, and 46% said they were online almost constantly in 2024.— Pew Research Center, Teens, Social Media and Technology 2024 · 2024 data
kids and tweens
- U.S. tweens (8–12) average 5 hours 33 minutes of screen media per day and teens (13–18) average 8 hours 39 minutes — up 17% for both groups between 2019 and 2021.— Common Sense Media, The Common Sense Census: Media Use by Tweens and Teens · 2021 data
phone pickups and notifications
Time is only half the story — frequency is what makes phones habit-forming. The interruption data below explains why 'just checking' turns into an hour.
- Over half of U.S. 11-to-17-year-olds receive 237 or more smartphone notifications in a typical day — about a quarter (23%) arriving during school hours.— Common Sense Media, “Constant Companion” report · 2023 data
- Teen participants in the same study checked their phones an average of over 100 times per day.— Common Sense Media, “Constant Companion” report · 2023 data
- People tap, swipe and click their phones an average of 2,617 times per day across 76 separate sessions; the heaviest 10% of users average 132 sessions a day.— dscout, “Mobile Touches” study · 2016 data
time per app: TikTok vs YouTube vs Instagram
| App | Time per day (typical user) | Opens per day |
|---|---|---|
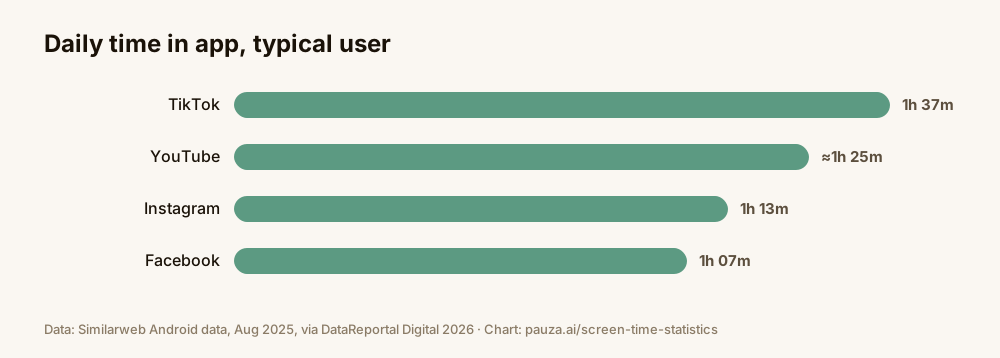
| TikTok | 1h 37m | ~10 |
| 1h 13m | — | |
| 1h 07m | — | |
| YouTube | ~1h 25m (≈14% less than TikTok) | 5.9 |
| — | 20+ |
- The typical TikTok user spends 1 hour 37 minutes per day in the Android app — about 14% longer than YouTube users. Instagram averages 1h 13m and Facebook 67 minutes per day.— DataReportal, Digital 2026 Global Overview (Similarweb) · 2025 data
- The typical WhatsApp user opens the app more than 20 times per day; TikTok users open it about 10 times, YouTube just 5.9 times.— DataReportal, Digital 2026 Global Overview (Similarweb) · 2025 data
screen time, sleep and mental health
- 45% of U.S. teens say social media hurts the amount of sleep they get (50% of girls vs 40% of boys), and 40% say it hurts their productivity.— Pew Research Center, Teens, Social Media and Mental Health · 2025 data
- 48% of teens say social media has a mostly negative effect on people their age — up from 32% in 2022.— Pew Research Center, Teens, Social Media and Mental Health · 2025 data
- In a study of 154,981 adolescents across 29 countries, problematic social media users reported significantly lower life satisfaction and more frequent psychological complaints than non-problematic users.— Boer et al., Journal of Adolescent Health · 2020 data
do people think they use their phone too much?
Yes — and increasingly so. This is the gap every screen time app lives in: most people already want to cut back.
- 58% of U.S. adult smartphone users say they use their phone “too much” — up from 39% in 2015. Among 18-to-29-year-olds it's 81%.— Gallup, “Americans Have Close but Wary Bond With Their Smartphone” · 2022 data
- 64% of Americans say they check their smartphone as soon as they wake up in the morning.— Gallup, “Americans Have Close but Wary Bond With Their Smartphone” · 2022 data
- 45% of U.S. teens say they spend too much time on social media (up from 27% in 2023), and 44% say they have cut back on social media use.— Pew Research Center, Teens, Social Media and Mental Health · 2025 data
how to cite this page
Feel free to reference any statistic on this page. Please credit the primary source named next to the number and link to this page for the compilation:
Pauza, “Screen Time Statistics 2026”, pauza.ai/screen-time-statistics. Updated July 2, 2026.
Want your own number to be lower next year? Pauza rewards you with tokens for every minute you spend off social media — and lets you bet a friend that you'll scroll less.
Get Pauza on iPhone